About the golf course
Pinecrest Golf Club is an 18-hole public golf course in Bluffton, SC. Just minutes away from Hilton Head Island, Pinecrest competes with numerous public golf courses within a 10 mile radius.
Measured timeframe
- October 1, 2019 – February 28, 2020
- October 1, 2020 – February 28, 2021
This timeframe was chosen due to the 10/06/2020 installation of the GolfBack booking engine on the Pinecrest website and we’re leaving out March numbers due to the pandemic of Covid-19 which swept the United States in March 2020.
Metrics reported
- Total Green Fee & Cart Fee Revenue as a whole
- Total Online Rounds including third-party marketplaces and website booking engine
- Daily Steal Rounds & Revenue (Club owned daily deals)
- Website Traffic and Conversions
Background
Pinecrest Golf Club previously used the following products before moving to the GolfBack platform:
- GolfNow distribution until 2/14/2020
- EzLinks Booking Engine until 4/7/2020
- ClubCaddie Booking Engine from 4/7/2020 – 10/5/2020
- EZLinks website until 4/7/2020
Website Traffic Analysis
GolfBack initially designed and began hosting the Pinecrest Golf Club website in early April 2020. Immediately we began to see an increase in website traffic due to a number of factors which you can read about here.
However, in the spirit of competition and to keep all things even in this report, we are only reporting the website stats from 10/1/2020 – 2/28/2021 and comparing them to the previous year.
Total Website Traffic
Definitions:
- Users: A website visitor that have initiated at least one session within the reporting period.
- Sessions: The period time a user is actively engaged with your website. A single recorded user can have more than one session.
- Organic Search: Users that landed on your website as a result of an internet search query.
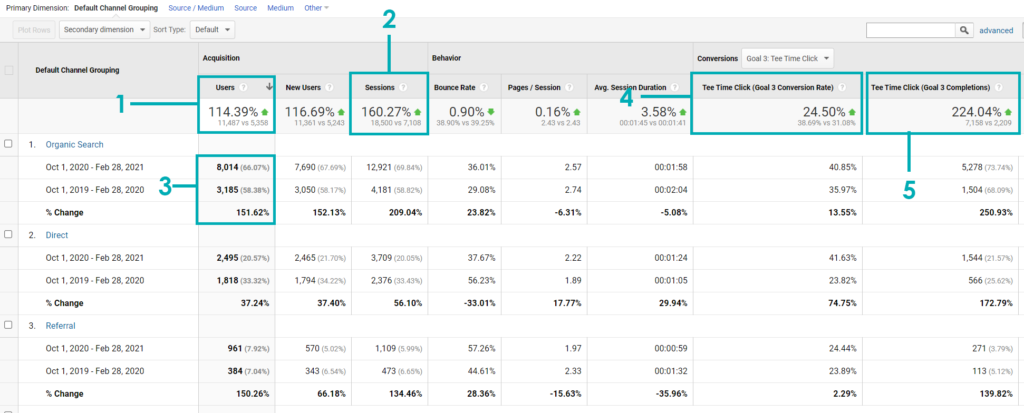
- Goal Conversions: Our goal shown below is to get website users to visit the online booking engine. The conversion rate is the number of unique sessions that resulted in a click to view the tee time inventory. The goal completion is the number of times this goal was, well, completed.
Click to enlarge the image below.
Website Traffic Results
- Total Website Users: Up 114% from 5,358 users to 11,487 users
- Total Sessions: Up 160% from 7,108 sessions to 11,500 sessions
- Organic Search Users: Up 151% from 3,185 users to 8,014 users
- Goal conversion rate: Increased by 24.5%
- Goal completions (Clicks to view the booking engine): Increased by 224% from 2,209 clicks to 7,158 clicks
Let’s chat for a second on how we were able to achieve this as I am sure you may take this increased traffic and conversions as being misleading.
Here are a couple of facts:
We now control the website and the code that makes it work. Which means we are no longer reliant on a website that is controlled by a third-party that makes the majority of its revenue by driving golfers away from your website to book in their marketplace. They have little incentive to grow your website traffic where driving traffic is one our main goals.
As you’ll see in the next section, our booking engine features numerous traffic driving features that add value to your golfers experience and keeps them coming back.
Booking Engine Rounds and Revenue Analysis
Click to enlarge the image below.
Online Rounds Analysis
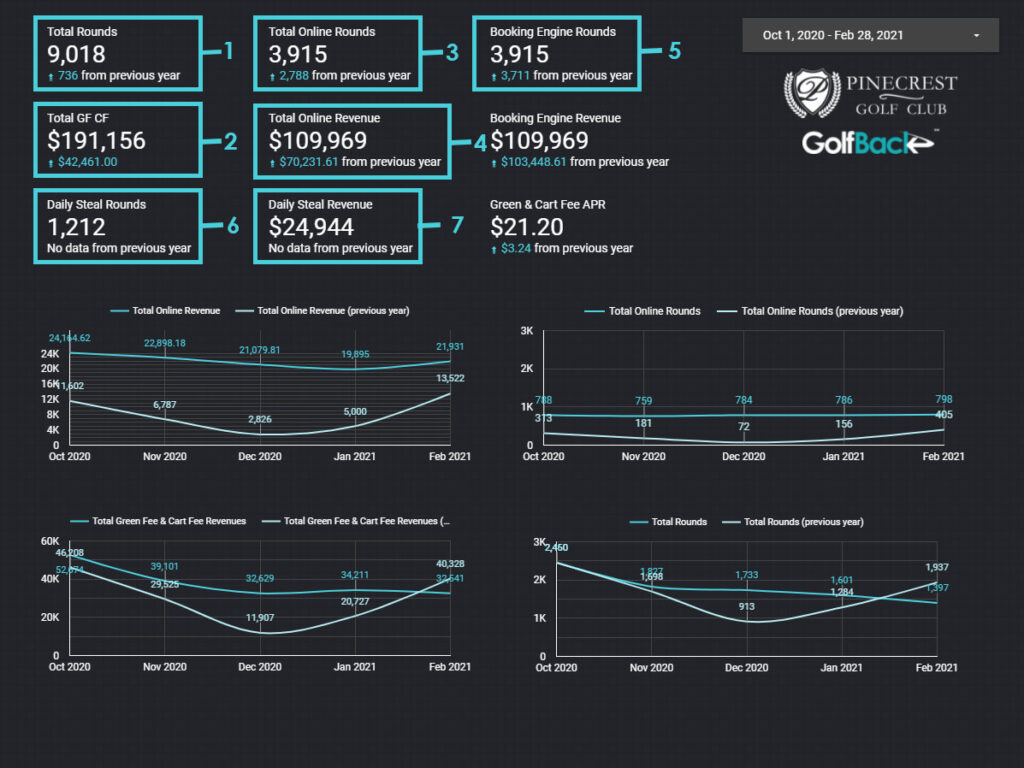
- Total Rounds: Up 8.9% from 8,282 to 9,018 (+736 rounds)
- Green & Cart Revenue: Up 28% from $148,695 to $191,156 (+$42,461)
- Total Online Rounds: Up 247% from 1,127 to 3,915 (+2,788 rounds)
- Total Online Revenue: Up 176% from $39,738 to $109,969 (+$70,231)
- Website Booking Engine Rounds: Up 1,819% from 204 to 3,915 (+3,711 rounds)
- Daily Steal Rounds: 1,212 Rounds
- Daily Steal Revenue: $24,944
While the total rounds growth seems smaller in comparison to online growth, we need to look to the total green and cart fee revenue increase of $42,461 YoY.
A large portion of this revenue increase is due to removing all bartered “hot deals” where the club receives $0 in revenue and implementing a Daily Steal that the club keeps 100% of the revenue – in this case $24,944 was returned to the club over 5 months.
By removing 3rd-parties, directing traffic through channels owned by the club, Pinecrest was not only able to grow rounds and revenue, they were able to automate the collecting and storage of golfer data. During this same timeframe, the club grew their total contact list by 19.72%, sent 564 automated emails, and they were just getting started.


